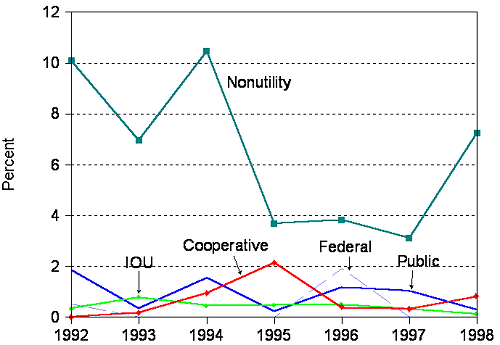
| Figure 16c. Annual Growth Rate of Utility and Nonutility Additions to Capacity, 1992-1998 |
 |
| a Data for power marketers are not included.
Sources: Energy Information Administration, Form EIA-759, “Monthly Power Plant Report,” Form EIA-860A, “Annual Electric Generator Report – Utility,” Form EIA-861, “Annual Electric Utility Report,” and Form EIA-860B, “Annual Electric Generator Report – Nonutility.” |
- Back to Chapter 3
- Table of Contents