|
|
|
In 2004, the freight rail industry in the United States faced a surge in demand for its services as the economy expanded, international trade increased, and farmers harvested bumper crops of grain. As demand for transport by freight rail heightened, policymakers, shippers, and transportation analysts expressed concern over whether the railroads would be able to meet shippers' needs. This Congressional Budget Office (CBO) paper--prepared at the request of the House Committee on Transportation and Infrastructure--examines the confluence of events that led to last year's rise in demand for rail transport and analyzes measures taken both by the railroads and by shippers to accommodate that demand. The review suggests that although some shippers did experience delays and added costs, major disruptions to the overall economy were avoided. In keeping with CBO's mandate to provide objective, impartial analysis, the paper makes no recommendations. Elizabeth Pinkston of CBO's Microeconomic and Financial Studies Division wrote the paper under the supervision of Roger Hitchner and David Moore. Several external reviewers offered valuable comments, including Michael Redisch and his colleagues at the Surface Transportation Board, Craig Rockey of the Association of American Railroads, Marvin Prater of the Department of Agriculture, and Francetta Willet of the Bureau of Labor Statistics. (The assistance of outside reviewers implies no responsibility for the final product, which rests solely with CBO.) Within CBO, Chad Chirico, Arlene Holen, and Tom Woodward provided helpful comments. Loretta Lettner edited the paper, and Christine Bogusz proofread it. Maureen Costantino designed the cover and prepared the paper for publication. Lenny Skutnik produced the printed copies, and Annette Kalicki prepared the electronic version for CBO's Web site. Douglas Holtz-Eakin
Summary and IntroductionIn 2004, as rail traffic reached all-time highs, policymakers and shippers expressed concerns about whether the freight rail industry would be able to meet an expected surge in demand for its services. The increasing demand for rail transport was fueled by an expanding economy, growth in international trade, and bumper grain harvests. The overriding concern--that shipping delays would adversely affect the overall economy--centered on the complex and somewhat elusive concept of capacity. In the transportation industries, "capacity" is usually defined in terms of a level of service, such as how many cars, trains, or airplanes can be handled efficiently and effectively by a facility or network in a given amount of time. Congestion occurs as the number of vehicles rises to such an extent that previous speeds are no longer sustainable. If the number of vehicles rises sufficiently, the "throughput" of the system--the number of vehicles or volume of cargo that passes a set point in a given amount of time--actually diminishes. In the extreme, a systemic breakdown may occur, in which traffic comes to a halt. Capacity can be constrained by a shortage of any critical input--infrastructure (for example, tracks or switching systems), equipment (locomotives and other railcars), or labor. And because the transportation industries are networks, the existence of capacity constraints at one key junction or along one key corridor can cause delays that cascade throughout the system. A late afternoon thunderstorm at a hub airport, for example, can cause airplanes destined for that hub to be grounded at numerous other locations. Even people traveling between cities with clear weather may be delayed, either because they have to travel through the disrupted hub or because the aircraft they are supposed to fly aboard has been held up. Such effects can occur in the freight rail industry and were a source of last year's concerns about potential systemwide problems. This Congressional Budget Office paper assesses those concerns and examines measures taken both by the railroads and by shippers to mitigate the effects of demand's outpacing capacity. Although shippers did experience some delays, inconvenience, and added costs, the railroads were able to meet most of the demand and avoid major disruption to the overall economy, despite carrying record volumes of freight. Throughout 2004, expectations that rail capacity might not be sufficient to meet a surge in demand for freight transportation--especially as the peak back-to-school and holiday seasons approached--received widespread coverage in the news media. An article in Traffic World, a major trade publication, reported in August 2004 that "the freight transportation industry is bracing for a peak season meltdown."(1) The article went on to explain that "the potential for a meltdown is part of an overall freight economy that's moving faster and heavier than ever but without a corresponding increase in infrastructure or capacity." The article further suggested that "potential problems loom largest at West Coast ports." A few months earlier, the Los Angeles Times had reported concerns about congestion at the busiest ports in the nation, the California ports of Los Angeles and Long Beach. It warned: "In the summer and fall, the ports' volumes will surge 30 percent or more as Asian goods arrive for the back-to-school and holiday seasons, and some observers fear that the increase will overwhelm Union Pacific [Railroad] and disrupt the economy if the bottlenecks aren't fixed."(2) The Department of Agriculture reported concerns about the availability of rail service in light of the agency's forecast of record crops and strong export demand: "Agricultural producers will have unusually stiff competition for limited rail capacity because year-to-date rail traffic is up across nearly all of the major commodity groups. Furthermore, some railroads are contending with rail service delays caused by the early retirement of train crew members, rail line and switching terminal congestion, and lack of equipment to handle unexpected demand."(3) In June 2004, Roger Nober, chairman of the Surface Transportation Board (STB), the federal agency charged with regulating the railroads and ensuring adequate service, wrote a letter to the heads of the seven major freight railroads asking how they intended to meet the unprecedented surge in demand.(4) In his correspondence, Nober expressed concern that the railroads' performance in recent months had faltered, as measured by several indicators. Those included factors such as the number of cars on-line, system train speed and yard dwell time, on-time performance, train- and engine-crew utilization, locomotive utilization, and infrastructure and capacity improvements. Responding individually, the railroads indicated that they were indeed facing unprecedented demand but that they were taking action, such as adding more equipment and hiring greater numbers of new employees than previously planned. Some railroads also stated that they were planning to reroute traffic to avoid bottlenecks.(5) In August 2004, the Association of American Railroads convened a meeting of representatives from its member railroads, the STB, shippers, and other interested parties to discuss potential problems arising from the surge in demand. At the STB's urging, the Union Pacific Railroad also held its own customer forum in San Francisco, and CSX Transportation held one in Atlanta. Throughout 2004, the demand for rail transportation was strong, setting an annual record for traffic as measured in ton-miles and setting weekly records for intermodal service (truck trailers and containers transported on railcars) in 28 weeks of the year.(6) Even so, as of April 2005, the feared "meltdown" of service had not materialized. Actions taken by the railroads to increase capacity or manage demand apparently were successful at avoiding massive systemic problems. The railroads dramatically accelerated their hiring and training, acquired new equipment, and modified their operations in order to increase capacity. They also raised rates on some commodities and services and asked shippers to moderate their demands. Shippers made accommodations in various ways to limitations in the availability of rail service. Some shippers combined into one shipment goods that might otherwise have been sent in several shipments. Some stockpiled materials in anticipation of delays, and some postponed making shipments at peak periods. Some sought alternative shipping methods, such as using less-congested rail routes, trucks, or air freight. As noted previously, as rail traffic continued to grow, railroads raised rates on certain commodities and services.(7) That market mechanism helped allocate the scarce capacity to shippers who valued it most, thus limiting potential damage to the economy. Other factors helped moderate demand for rail transportation. For example, although 2004 marked the second year in a row of record grain harvests, grain prices were somewhat weaker than in 2003. That development may have reduced pressures to sell--and consequently transport--grain, which many farmers had reportedly felt the previous year. In addition, the combined ports of Los Angeles and Long Beach experienced problems getting enough workers to unload ships in a timely manner, creating a major bottleneck and thus moderating the flow of shipments to the railroads. At one point, there were reportedly 94 cargo ships waiting to be unloaded, and 43 of those could not even get into the harbor.(8) In sum, the freight market functioned well in the short run: price signals were sent and received, allowing the costs associated with an increase in demand to be accommodated without serious damage to the economy. Yet certain factors that contributed to the surge in demand--increased international trade and intermodal shipping--are likely to continue to grow in the future. That raises questions about how the market will work to provide sufficient capacity for the transportation of freight and how federal policy will influence the mix of capacity among rail, road, and water carriers. Such longer-term considerations, however, are beyond the scope of this review.
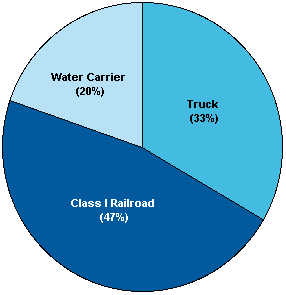
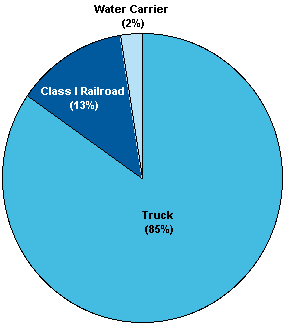
The Railroad Industry and the EconomyThere are seven Class I freight railroad systems--defined by the Surface Transportation Board as those with more than $277.7 million in annual revenues in 2003--in the United States.(9) Four of those railroads together account for 93 percent of operating revenues and 94 percent of the ton-miles of Class I railroads. They are the Union Pacific Railroad Company (UP) and BNSF Railway (formerly known as the Burlington Northern Santa Fe), which operate in the western United States, and CSX Transportation, Inc., and Norfolk Southern Railway, which operate in the East. The three smaller Class I railroads are the Grand Trunk Corporation (a unit of the Canadian National Railway Company), Soo Line Railroad Company (a unit of Canadian Pacific Railway), and Kansas City Southern Railway Company. Railroads in the United States transport about 47 percent of freight, measured in ton-miles, and 30 percent, measured in tons (see Figures 1 and 2).(10) In 2003, they carried 1.8 billion tons of freight a total of about 1.6 trillion ton-miles.(11) Because rail rates are generally lower than rates for trucking or air freight, however, railroads take in only about 13 percent of intercity freight revenue--about $33.5 billion in 2001 (see Figure 3).(12)
Distribution of Intercity Freight Traffic, by Mode of Transport, Measured in Ton-Miles, 2001 (Percentage of ton-miles)
 Source: Department of Transportation, Bureau of Transportation Statistics, National Transportation Statistics 2004 (January 2005), Table 1-46, available at www.bts.dot.gov/publications/national_transportation_statistics/2004/index.html.
Distribution of Intercity Freight Traffic, by Mode of Transport, Measured in Tons, 2001 (Percent)
 Source: Rosalyn A. Wilson, Transportation in America, 19th ed. (Washington, D.C.: Eno Transportation Foundation, 2002), p. 44.
Distribution of Freight Revenues, by Mode of Transport, 2001 (Percent)
 Source: Department of Transportation, Bureau of Transportation Statistics, National Transportation Statistics 2004 (January 2005), Table 3-18, available at www.bts.dot.gov/publications/national_transportation_statistics/2004/index.html.
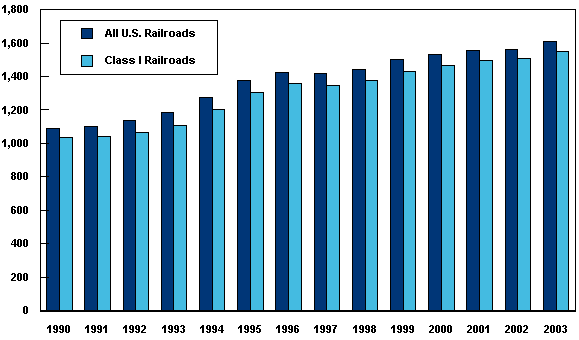
Railroads carried shipments valued at $320.5 billion in 2002. By comparison, during the same period, trucks transported shipments worth $6.2 trillion, air carriers transported shipments worth $279.5 billion, and water carriers transported freight worth $90.9 billion.(13) The value of freight rail shipments in 2002 represented 3.1 percent of gross domestic product (GDP) for that year; it was 10.7 percent of the nonservice (durable plus nondurable goods) portion of GDP.(14) The value of rail shipments accounted for nearly 17 percent of the value of goods imported into and exported from the United States in 2002.(15) Rail transportation is particularly important to certain industries. About 70 percent of coal delivered to power plants in the United States travels by rail, as does about 70 percent of all automobiles manufactured domestically."(16) Approximately 32 percent of grain shipments are transported by rail.(17) The chemical industry also relies heavily on railroads. With the exception of a slight dip in 1997, rail traffic, as measured in ton-miles, has risen steadily since 1990 (see Figures 4 and 5). A market segment that has experienced particularly rapid growth is intermodal transportation. Strictly speaking, "intermodal" refers to any shipments that are carried by more than one mode, such as rail and truck or rail and water carrier (for example, ocean liners or barges). But it also generally connotes coordinated movement of freight that remains in the same container or truck trailer until it reaches its final destination.
Freight Transported by U.S. Railroads, Measured in Ton-Miles, 1890 to 2003 (Billions)
 Sources: Association of American Railroads, Railroad Facts, 2004 Edition (Washington, D.C.: AAR, October 2004), pp. 27 and 32, and Rosalyn A. Wilson, Transportation in America, 2000, 18th ed. (Washington, D.C.: Eno Transportation Foundation, 2001), p. 12.
Freight Transported by U.S. Railroads, Measured in Ton-Miles, 1990 to 2003 (Billions)
 Sources: Association of American Railroads, Railroad Facts, 2004 Edition (Washington, D.C.: AAR, October 2004), pp. 27 and 32, and Rosalyn A. Wilson, Transportation in America, 2000, 18th ed. (Washington, D.C.: Eno Transportation Foundation, 2001), p. 12.
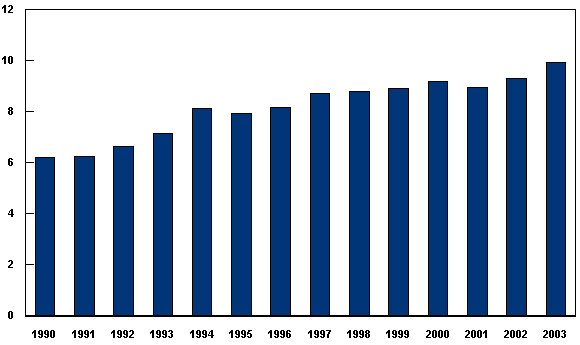
Intermodal traffic--as measured by the number of trailers and containers on railcars--grew by 60.2 percent between 1990 and 2003, while the total number of rail carloads (including intermodal traffic) grew by 35 percent during that period (see Figure 6 and Figure 7).(18) About half of rail intermodal shipments are exports or imports--a growing part of the overall U.S. economy.(19)
Intermodal Traffic, Measured by Numbers of Shipping Containers and Trailers, 1990 to 2003 (Millions)
 Source: Association of American Railroads, Railroad Facts, 2004 Edition (Washington, D.C.: AAR, October 2004), p. 26.
Carloads of Freight Transported by Rail, 1990 to 2003 (Millions)
 Source: Association of American Railroads, Railroad Facts, 2004 Edition (Washington, D.C.: AAR, October 2004), p. 24.
Technological advances in railroad equipment over the past two decades have propelled intermodal growth. The development of equipment that can carry large containers on either railcars or trucks and that can carry multiple containers on a single railcar has reduced shipping costs. The emergence of intermodal transportation has affected the relationship between the freight rail and trucking industries: trucking companies are both competitors to railroads and major customers and collaborators as well. For example, the large trucking and logistics company Schneider National no longer transports freight by truck between Los Angeles and Chicago; instead, it loads truck trailers on railcars for that trip.(20) In December 2004, a spokesman for United Parcel Service (UPS), which spent an estimated $750 million on rail service in 2004, was quoted as saying: "If a ground package is going 750 miles or more, it is more economical and efficient for us to load the trailers, move them to the railhead, and put them on a flatcar" than it is to send the same package by truck.(21) Freight sent by rail generally has to travel by truck for local pickup and/or delivery, unless both the shipper and customer have direct rail access (as is mostly the case for coal, which trains can carry straight from the mine to a power plant).
Recent Increases in Rail TrafficIn 2004, rail traffic reached new highs. The number of nonintermodal carloads of freight (17.4 million) was 2.9 percent higher than in 2003, and intermodal traffic--nearly 11 million trailers and containers--was up by 10.4 percent.(22) As previously noted, intermodal volume set weekly records in 28 weeks of 2004 (see Figure 8). The Association of American Railroads reported that total traffic as measured in ton-miles--an estimated 1.61 trillion ton-miles--"was also higher in 2004 than ever before."(23)
Weekly Traffic Statistics for Major U.S. Railroads, by Carloads and Intermodal Units, 2003 to 2004 (Thousands)
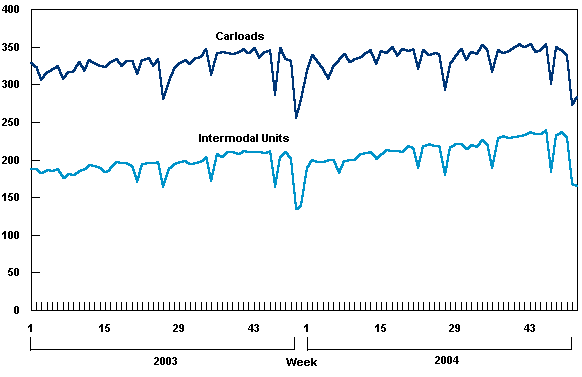 Source: Association of American Railroads, "Weekly Traffic of Major U.S. Railroads," available from weekly press releases at www.aar.org. The increase in overall economic activity, growth in international trade, and large grain harvests all contributed to an increase in demand for rail transportation. The economy continued its recovery in 2004, with real (inflation-adjusted) gross domestic product 3.8 percent higher in the fourth quarter of 2004 than in the fourth quarter of 2003.(24) Nominal GDP (based on current-dollar values) rose by 6.2 percent in that time period. International trade continued to grow in 2004, fueling demand for rail transportation. The value of goods imported into the United States rose by $213.1 billion from 2003, to a total of $1,473.8 billion.(25) The value of goods exported rose by $94.5 billion from 2003, to a total of $807.6 billion. Exports of grain and feed rose from $14.8 billion in fiscal year 2003 to $17.9 billion in fiscal year 2004.(26) In terms of volume--a unit relevant for measuring the demand for rail transportation--wheat exports rose from 24.3 million metric tons in fiscal year 2003 to 31.1 million metric tons in fiscal year 2004, and exports of coarse grains (corn, barley, sorghum, oats, and rye) increased from 46.1 million metric tons to 52.6 million metric tons.(27) Adding to the demand for rail transportation from West Coast ports--particularly the ports of Los Angeles and Long Beach--were imports from Asia. Total imports from China rose to nearly $197 billion in 2004 from $152 billion in 2003.(28) The rising costs facing the trucking industry, the railroads' major competitor, have contributed to an increase in demand for rail. Trucking companies have apparently found it difficult to attract enough drivers willing to endure the lengthy separations from home and family that are characteristic of long-distance trucking. Scott Arves, the transportation-sector president of Schneider National, which employs 15,000 drivers, has suggested that the "average annual pay for a truckload driver may have to rise from about $40,000 to $60,000." In 2004, Schneider offered a $5,000 signing bonus to experienced drivers.(29) Moreover, escalating fuel prices have affected truckers as well as railroads. Both trucking companies and railroads typically impose surcharges that reflect increases in fuel prices, but those surcharges have not kept pace with rising fuel costs.(30)
Industry and Market Responses to Increased DemandRailroads and shippers took a number of steps in 2004 to avert the feared breakdown in rail service. In addition, outside events helped relieve pressures on the rail transportation system. Actions Taken by the RailroadsIn response to rising demand for their services, the railroad companies took several actions: they increased supply, raised rates, and imposed limits on shippers. Increasing Supply. As they indicated in their respective responses to the chairman of the Surface Transportation Board, the railroads added more cars, engines, and other equipment than they had planned, and they hired and trained more new engineers and conductors than they had in many decades. For example, the Union Pacific Railroad hired more than 5,000 workers to help meet increased demand. It also completed an additional 10 miles of double track west of El Paso, Tex., along the congested Sunset Route.(31) Norfolk Southern hired more than 2,000 train and engine crew members, purchased more than 200 locomotives, and continued testing and implementing train control technologies.(32) CSX hired about 1,400 train and engine employees, purchased or leased about 280 locomotives, and implemented the first phase of its "ONE Plan" to improve network efficiency.(33) BNSF hired about 3,000 employees in 2004 and expects to add about the same number in 2005.(34) The railroad is working to finish double-tracking the single-track segments of its intermodal network in the Southwest and to add sidetracks and improve tunnel capacity on its northern lines.(35) It also undertook initiatives to improve the flow of trains through terminals and to increase the number of cars per train in order to enhance capacity.(36) Where possible, several railroads rerouted traffic to avoid bottlenecks, even though that entailed some trains' having to travel greater distances. Increasing Rail Rates. As demand rose in 2004, the railroads increased their rates, as reflected in the Bureau of Labor Statistics' (BLS's) producer price index (PPI) series (see Figure 9).(37) Rates for intermodal service rose by 5.6 percent from January 2004 to December 2004, compared with 1.8 percent from January 2003 to December 2003.(38) Rates for carload service rose by 6.5 percent from January 2004 to December 2004, compared with 2.6 percent from January 2003 to December 2003.(39) The PPI for finished goods rose by 3.4 percent from January to December 2004 and by 2.6 percent from January to December 2003 (see Figure 10).(40) Railroads are continuing to raise their rates in 2005. For example, the Union Pacific has announced rate increases ranging from 8 percent to 100 percent for goods shipped to and from Arizona, where the Phoenix yard is clogged with traffic.(41)
Rail Price Indexes, January 2003 to December 2004 (January 2003 = 100)
 Source: Department of Labor, Bureau of Labor Statistics, Producer Price Index Industry Data, available at www.bls.gov. Producer Price Indexes for the Freight Rail Industry Compared with Those for Finished Goods, January 2003 to December 2004 (January 2003 = 100)
 Source: Department of Labor, Bureau of Labor Statistics, Producer Price Index Industry Data, available at www.bls.gov. In 2004, the railroads were able to raise rates for some traffic to adjust to changes in market conditions. That experience suggests that the railroads have greater flexibility in rate-making compared with the regulatory environment in which they once operated. The amount of rail traffic subject to rate regulation was substantially reduced by the Staggers Rail Act of 1980, although the Surface Transportation Board still has authority to regulate rates on traffic for which certain conditions are met.(42) Rates that are potentially subject to regulation are those that are available to shippers as part of railroads' "common-carrier obligation."(43) Common-carrier rates are subject to maximum-rate regulation only where the STB finds the existence of market dominance by a railroad. To make a finding of market dominance, the STB must determine that there is no effective competition from other railroads or other modes of transportation for the traffic in question and that the revenues from that traffic equal or exceed 180 percent of the railroad's variable cost of providing the service. The other major set of rates are those that are covered by individual contracts between railroads and shippers. They are not subject to STB regulation, except that the terms of contracts for certain agricultural commodities must be filed with the STB. A large portion of rail traffic--estimated in 1999 to be about 70 percent, measured in tons--moves under long-term contracts for which rates can change only as the contracts provide.(44) Contracts often have cost-adjustment provisions based on indexes such as the STB's "Rail Cost Adjustment Factor" (RCAF).(45) Demand-based adjustments may have been rare in past contracts, but at least one railroad reportedly is planning to include provisions for turning away traffic if the volume of a customer's shipments exceeds a set amount.(46) In any event, the BLS price index data suggest that railroads have been able to raise rates within the terms of their contracts. Moreover, the average length of contracts has shortened in recent years. Contracts for coal movements negotiated in the first few years after the Staggers Act went into effect reportedly were for periods as long as 20 years, as electric utilities and railroads sought to lock in rates and service levels. In recent years, as both railroads and electric companies have been buffeted by regulatory and market changes, they have been more reluctant to enter into such lengthy contracts. In sum, the ability of railroads to raise rates served as an indicator of a surge in demand, a mechanism for allocating scarce capacity to shippers who valued it most highly, and a signal that more investment is needed to increase capacity. Imposing Limits on Shippers. Railroads also asked customers to limit or consolidate shipments or otherwise moderate their demands. For example, Union Pacific discontinued expedited intermodal service to United Parcel Service on the busy Sunset Route between Los Angeles and El Paso.(47) The UP also set limits on the number of railcars available to carry aggregates in Texas, requiring shippers to wait until they had full carloads. By combining shipments into fewer but longer trains, that action subsequently enabled UP to move 48 percent more rock traffic.(48) According to the Los Angeles Times, BNSF "set limits on some eastbound international cargo from Los Angeles to prevent congestion as Asian imports rise. The company started a system on June 18 [2004] that sets maximum container-cargo volumes for ocean-shipment haulers."(49) Such actions imposed costs on shippers--costs that are difficult to identify and quantify--such as those associated with holding inventories. Actions Taken by ShippersSeasonal and cyclical shortages of capacity can be disruptive--at a minimum to the rail customers whose shipments are delayed, and sometimes also to workers and businesses in ancillary industries. There often are ways of responding to such shortages, however. The predictability of seasonal fluctuations enables some shippers to take measures to reduce potential disruptions associated with expected surges in demand, such as those of the fall peak season when merchandise is being shipped for the year-end holidays and when agricultural crops are harvested. For example, manufacturers and retailers could ship products to regional warehouses earlier in the year. That, of course, would entail higher inventory and storage costs than a just-in-time approach, but companies can make their own calculations as to whether incurring those costs would outweigh the risk of not having enough goods on the shelf to sell at a time of peak consumer demand. Some agricultural shippers have more flexibility than others, because nonperishables often can be stored for short periods until rail capacity is available. Temporary storage of grain under less-than-ideal conditions, however, usually results in some loss of value. Most rail shippers also can use alternative modes of transportation. Agricultural and other goods that are not time-sensitive can be shipped by barge if they originate along a waterway or close enough to one to be taken there economically by truck. High-value, relatively lightweight goods can go by air freight. Trucks can handle most shipments that otherwise would go by rail, albeit more expensively.(50) (Trucking companies' recent difficulties in finding enough qualified long-distance drivers rendered trucks somewhat less able than in past years to meet rising demand.) Some shipments from Asia that would have gone to Southern California ports could instead go to other Pacific ports, or they could go through the Panama Canal to East Coast ports--although the latter would increase transit time, and many ocean liners now are too big to traverse the canal. Shippers made such adjustments in response to the events of 2004. For example, after encountering delays in shipping engines and other vehicle parts from California, Toyota Motor Corporation increasingly relied on truck transportation.(51) After the Union Pacific Railroad pushed UPS trailers off its system in April 2004, other major trucking companies also shifted away from intermodal service. The chief executive officer of the large trucking company Yellow Roadway was reported in August 2004 as saying, "We've had to take more and more freight off the rail and put it on the road. There has been no sign of improvement." Some shippers reportedly had to stop production temporarily, and one indicated that the lack of railcars "was having a significant cost impact."(52) Events That Eased Demand PressuresCertain events also helped relieve pressure on the railroad system. Agricultural shippers reportedly placed less demand on the rail system in the fall of 2004 than they had in the fall of 2003 (and than had been expected in 2004, in light of the bumper crops). Grain prices were generally not as high in the fall of 2004 as in the previous autumn. As a result, the opportunity cost of storing rather than selling their crops immediately was less than it was the previous year, and farmers may have decided to hold crops in storage in anticipation of higher prices in coming months. For each week of the last three months of 2004, grain-car loadings were less than the three-year average for that week.(53) Also relieving pressure on the railroads were delays in unloading ships at the ports of Los Angeles and Long Beach. As noted earlier, the lack of enough dockworkers kept some ships waiting much longer than usual to be unloaded and helped moderate the flow of goods to the railroads.(54)
Policy ImplicationsThe recent surge in demand for freight rail transportation appears to have been accommodated without significant effects on the overall economy and without substantial government intervention. The expression of concern by the Surface Transportation Board about the potential for a breakdown in service may have prompted the railroads to enhance their efforts to meet demand, but it would have been in the railroads' own interest to do so anyway. If a temporary increase in demand stretches rail capacity to its limits, that does not imply a need for government intervention. In most industries, shortages of a product or service simply indicate a need for price increases in order to clear the market. If higher demand is the result of seasonal factors, producers may find it economically unproductive to expand their capacity to meet peak demand because then there would be excess capacity lying idle the rest of the time. The demand for rail service has been trending upward, however, even when overall economic activity has dipped. That development suggests a need to consider how rising demand for freight transportation will be met in the future. It raises issues about whether current public policies affecting the rail industry--and, indeed, policies affecting the other freight transportation industries as well--are likely to lead to productive investments in transportation infrastructure and an economically efficient allocation of resources among transportation modes. Those issues are beyond the scope of this paper.
|
||||||||||||||||||||||||||||||||||||||||||||||||||||||||||||||||||||||||||||||||||||||||||||||||||||||||||||||||||||||||||||||||||||||||||||||||||||||||||||||||||||||||||||||