|
|
|
On January 24, 2005, the Congressional Budget Office (CBO) released The Budget and Economic Outlook: Fiscal Years 2006 to 2015. Chapter 1 of that report discusses the uncertainty of CBO's baseline projection of the total budget balance and includes a figure illustrating how the uncertainty increases as the projections extend into the future. This supplementary report describes the data and methods used to construct that figure. Ufuk Demiroglu and Frank Russek of CBO's Macroeconomic Analysis Division wrote this report under the direction of Robert Dennis. Adam Gordon provided research assistance, and Linda Lewis Harris helped in the early stages of the document's preparation. John Skeen edited the report, and Maureen Costantino prepared it for publication. Annette Kalicki produced the electronic version for CBO's Web site. Douglas Holtz-Eakin
On January 25, 2005, the Congressional Budget Office (CBO) released The Budget and Economic Outlook: Fiscal Years 2006 to 2015, which presents CBO's latest projections of federal revenues and outlays for that period. Chapter 1 of that report includes a brief discussion of the uncertainty in CBO's baseline projection of the total budget balance and shows a figure (reproduced here as Figure 1) illustrating how that uncertainty increases as the projections extend into the future. This supplementary report describes the data and methods used to construct that figure. In brief, CBO calculated measures of uncertainty using the inaccuracies in its past projections that arose from economic and technical factors. Uncertainty arising from legislation was not considered because baseline projections assume that current tax and spending policies remain in place.
Uncertainty of CBO's Projections of the Budget Deficit or Surplus Under Current Policies (Deficit or surplus as a percentage of GDP)
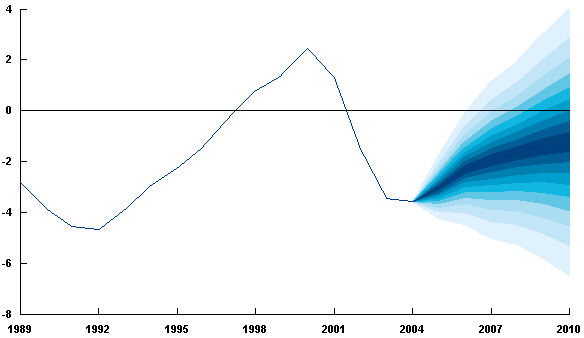 Source: Congressional Budget Office. Notes: This figure, calculated on the basis of CBO's forecasting track record, shows the estimated likelihood of alternative projections of the budget deficit or surplus under current policies. The baseline projections described in The Budget and Economic Outlook: Fiscal Years 2006 to 2015 fall in the middle of the darkest area of the figure. Under the assumption that tax and spending policies will not change, the probability is 10 percent that actual deficits or surpluses will fall in the darkest area and 90 percent that they will fall within the whole shaded area. Actual deficits or surpluses will be affected by legislation enacted in future years, including decisions about discretionary spending. The effects of future legislation are not reflected in this figure. Figure 1 presents CBO's baseline projection of the budget balance as a fan of probabilities around the mean projection for 2005 through 2010. The fan widens as the projection period extends. The baseline projection falls in the middle of the highest-probability area--the darkest part of the figure. But the figure makes clear that nearby projections--other paths in the darkest part of the figure--have nearly the same probability of occurring as the baseline projection does. Moreover, projections that are quite different from the baseline have a significant probability of being realized.(1) The shaded area in the figure represents the 90 percent confidence range (the range within which the actual value for each year has a 90 percent chance of falling). CBO estimates that range on the basis of the uncertainty in its historical record of budget projections--a total of 23 baselines spanning the period from 1981 to 2004.(2) In other words, the estimates of uncertainty presume that, in the future, CBO's projections will be subject to inaccuracies similar to those experienced in the past, with about the same probability distribution of large and small inaccuracies. CBO's analysis of uncertainty separates inaccuracies correlated with the business cycle from those that are not. That distinction helps in estimating the probability distribution of the inaccuracies, as discussed later in this report. Cyclical inaccuracies are not expected to grow after the first few years of a projection's horizon, whereas noncyclical inaccuracies may persistently grow as the projection's horizon lengthens. According to CBO's estimates, cyclical inaccuracies historically have been small for the first two years of a baseline projection, the period for which CBO incorporates its views of the business cycle in its forecasts. Those cyclical inaccuracies rise in the later years of a projection--when CBO does not try to forecast the business cycle--but then flatten out (see Figure 2).
Cyclical and Noncyclical Inaccuracies in Projecting the Primary Deficit or Surplus (Percentage of total revenues)
 Source: Congressional Budget Office. Notes: The lines in this figure show root-mean-square errors (RMSEs), a type of average that ignores the signs of individual errors and gives greater weight to larger errors. The RMSE of the total inaccuracy is equal to a value calculated by squaring the RMSEs of the cyclical and noncyclical parts, adding them together, and taking the square root of the sum. Thus, the combined RMSE is smaller than the sum of the two components' RMSEs. The primary budget deficit or surplus is the difference between federal revenues and federal outlays excluding net interest. Noncyclical inaccuracies, by contrast, continue to grow in the later years.(3) That breakdown suggests that, on average, CBO's inaccuracies in projecting the budget's bottom line have consisted, in roughly equal parts, of cyclical inaccuracies and of inaccuracies in assessing economic trends and noncyclical factors that underlie the budget. The 1981-2004 sample period is not typical of the post-World War II period as a whole. It contains only three recessions (those of 1981 and 1982, 1990 and 1991, and 2001)--compared with seven in the earlier post-World War II years--and the two most recent recessions were milder than average. Moreover, the 1981-1982 recession is not well represented in the sample because only one of the baseline projections preceded it. If CBO had been confronted over the past two decades with a less stable economy--one more representative of the cyclical experience of the whole post-World War II period--the cyclical component would have been roughly one-third larger than the noncyclical component, on average. However, even if CBO takes into account the greater volatility of output in that entire post-World War II period, the width of the fan chart increases by about 10 percent through the second year of the projection and by one-fourth in the third through fifth years of the projection. Whether the next decade will more closely resemble the past two decades or the entire postwar period cannot be determined in advance. However, recent research suggests that fundamental changes in the economy that occurred in the early 1980s may have resulted in fewer and milder cyclical movements in the past two decades and may presage a relatively stable economy in the future. Analysts differ on the nature of those changes but generally do not expect a return to higher volatility in the next five years--but, rather, volatility that may be lower than it has been in the past two decades.(4) Preparing the fan chart involved two stages. In the first stage, CBO constructed measures of its past projection inaccuracies that remove the effects of changes in legislation and other factors. In the second stage, CBO constructed probability distributions at six time horizons, beginning with the current fiscal year (the one in which the projection was made) and covering the next five years. The probability distributions were derived from a model that distinguishes between inaccuracies that appear to stem from the difficulty of forecasting the business cycle and inaccuracies that are not correlated with the business cycle and appear to stem from other causes.
Stage One: Constructing the Measures of InaccuraciesCreating measures of inaccuracies in CBO's past budget projections involved adjusting those projections for two factors: legislation (including laws that affect discretionary spending) and net interest on the federal debt. CBO added to its projections of revenues and outlays the estimated effects of laws concerning revenues or mandatory spending that were enacted after the projections were made. That adjustment was necessary because CBO's baseline projections are intended to show the future level of the budget deficit or surplus under the assumption that current tax and spending policies remain the same.(5) Without that adjustment to take into account subsequent tax and spending legislation, the measures of inaccuracies would reflect the effects of later policy changes, which would run counter to the purpose of the baseline. CBO excluded discretionary spending from both the baseline projections and actual outlays. The effect of omitting discretionary spending is to treat all discrepancies between actual discretionary spending and baseline projections of such spending in the same way as differences resulting from other budget legislation.(6) In CBO's usual analyses of changes in its projections since the previous baseline, CBO assigns a small proportion of the changes in assumptions about discretionary outlays to the categories of economic or technical revisions, but legislation accounts for nearly all of the overall change in the form of new budget authority. CBO decided on its approach for several reasons: First, it permits the use of a longer historical record. Second, levels of discretionary spending are determined anew each year through appropriation acts, and any discrepancy between actual levels and baseline projections of discretionary spending is essentially attributable to legislation. Third, the economic and technical inaccuracies in projecting discretionary outlays are small, so attributing all of those inaccuracies to legislation does not affect the measures of inaccuracies very much. Inaccuracies in projecting net interest largely result from inaccuracies in projecting the government's publicly held debt. That debt, in turn, is the cumulation of past budget deficits (minus surpluses), so inaccuracies in projecting net interest depend on the cumulation of inaccuracies in projecting the deficit or surplus. The final fan-chart calculations include all those effects on net interest. CBO calculated inaccuracies for each year covered by the winter baseline projections that it published from 1981 through 2004. In most years, those projections were issued in January or February, although in 1996, publication was delayed until May. For reasons involving the availability of data, CBO used its July 1981 projection in place of the one published in February 1982.(7) The resulting sample was small: only 23 current-year projections, declining to 18 five-year-ahead projections.(8) (The sample size diminishes because projections made in the past five years can be compared with actual outcomes only through 2004.) The estimated effects of legislation concerning revenues or mandatory spending were taken primarily from information published in CBO's twice-yearly reports on the budget and economic outlook. Most of those reports show the multiyear budgetary effects of legislation enacted since the previous projections were made. For cases in which estimates were not available (as will be discussed below), substitutes were constructed.(9) RevenuesThe Joint Committee on Taxation (JCT) estimates the effects of tax legislation--bills that amend the Internal Revenue Code to alter income, estate and gift, excise, and Social Security payroll taxes--that is considered in a session of Congress, and provides the estimates to the Congressional Budget Office for use during that session.(10) CBO is responsible for producing estimates for all other legislation that affects revenues. Those estimated effects of tax legislation were used to adjust each baseline projection of revenues. For example, the projection made in January 1999 for total revenues in 2004 was lowered from $2,184 billion to $1,913 billion (see Table 1). That adjustment reflected all tax laws enacted after January 1999 and through fiscal year 2004. The three laws with the largest budgetary impacts were the Economic Growth and Tax Relief Reconciliation Act of 2001 (EGTRRA), the Job Creation and Worker Assistance Act of 2002 (JCWAA), and the Jobs and Growth Tax Relief Reconciliation Act of 2003 (JGTRRA).
Example: How CBO's January 1999 Revenue Projection Was Adjusted for Subsequent Legislation (Billions of dollars)
JCT and CBO estimated that EGTRRA, JCWAA, and JGTRRA, respectively, would reduce revenues in fiscal year 2004 by $101 billion, $30 billion, and $135 billion.(11) Similar adjustments were made for the other years in the baseline projections and for all of the other pieces of tax legislation. The differences between those adjusted projections and actual revenues represent the inaccuracies attributable to economic and technical factors (see Table 2).
Inaccuracies in CBO's Baseline Projections of Revenues That Are Attributable to Economic and Technical Factors (Percentage of actual revenues)
JCT's and CBO's estimates of the effects of tax legislation generally are not revised after their initial publication, even though later economic and technical information might permit better estimates. (For instance, knowledge about an actual tax base, such as wages or corporate profits, in a given year would improve estimates of how a change in tax law would affect revenues.) Using unrevised estimates of the budgetary impacts of tax and spending legislation could affect the estimates of uncertainty in CBO's baseline budget projections, but the direction and size of that effect are unclear. OutlaysThe estimated effects of legislation on outlays (excluding net interest) were also taken largely from CBO's reports on the budget and economic outlook. However, as with revenues, some adjustments to that information were necessary. Baseline Projections of Discretionary Spending. As noted previously, differences between actual and projected levels of discretionary spending were assumed to be attributable to legislation. But the July 1981 baseline projection did not include a separate category for discretionary spending. For that baseline only, discretionary spending was approximated by adding the projections for defense, other grants to state and local governments, and other federal operations.(12) Insufficient Details About Legislation. In some cases, the estimated effects of legislation were not reported in enough detail to separate out the effects of legislation on mandatory spending. In other cases, the information was published for some but not all of the six years in the baseline budget projection. One or both of those problems applied to the following periods: August 1986 to January 1987, August 1987 to February 1988, August 1994 to January 1995, and January 1998 to August 1998. In those cases, supplemental information from CBO's files was used to estimate the needed numbers. As with revenues, the estimated effects of legislation on outlays were used to adjust each baseline projection of outlays. After removing interest payments and discretionary outlays, the differences between those adjusted projections and actual outlays are the inaccuracies attributable to economic and technical factors (see Table 3).
Inaccuracies in CBO's Baseline Projections of Outlays That Are Attributable to Economic and Technical Factors (Percentage of actual revenues)
Primary Budget Deficit or SurplusThe difference between revenues and outlays excluding net interest is known as the primary budget surplus (or deficit when negative). Correspondingly, CBO's inaccuracies in projecting revenues, minus its inaccuracies in projecting noninterest outlays, equal its inaccuracies in projecting the primary deficit or surplus (see Table 4). As described previously, that calculation excludes legislative changes. In stage two of the fan-chart preparation, the inaccuracies in projecting the primary budget deficit or surplus were cumulated into inaccuracies in projecting publicly held debt, which were used to estimate the uncertainty of CBO's projections of net interest.
Inaccuracies in CBO's Baseline Projections of the Primary Deficit or Surplus That Are Attributable to Economic and Technical Factors (Percentage of actual revenues)
Stage Two: Constructing Probability DistributionsThe historical record of inaccuracies in projecting the primary deficit or surplus (adjusted for legislation) presented in Table 4 forms the basis for the statistical calculations that CBO used to derive the probability distributions underlying the fan chart. As noted above, CBO's record of projections is both short and possibly unrepresentative (in that it is taken from a period that contains fewer and less frequent business cycles than occurred historically). In the absence of a large sample, estimates may be improved if additional information can be brought to bear. In this case, CBO used its knowledge of its forecasting procedures and of business cycles, as well as its historical record, to draw more reliable conclusions about the probability distribution of inaccuracies in its budget projections. The Statistical Model for Inaccuracies in Forecasts of the Primary Deficit or SurplusWith the effects of legislation removed, CBO's past inaccuracies are closely related to errors in the projection of the business cycle. Forecasting the course of a business cycle more than two years ahead is virtually impossible, so CBO has traditionally tried to incorporate the business cycle in its economic projections explicitly for only the current year and the budget year.(13) In its projections for longer horizons, CBO simply assumes that gross domestic product (GDP) will, on average, adhere to its trend (or "potential") path.(14) That assumption recognizes that, in fact, GDP will sometimes be above and sometimes below its potential level, but CBO does not attempt to forecast those boom or recession periods more than a couple of years ahead. As long as CBO continues to do a reasonably good job of forecasting the business cycle for the current year, that cycle should not contribute much to the inaccuracy of current-year budget projections. For the budget year, its contribution should be larger (because errors in forecasting increase as the horizon lengthens) but still modest. For later years, however, cyclical factors should loom larger. For the last two years of the five-year projection period, CBO assumes that GDP is the same as or close to its potential level. Thus, any actual difference between GDP and its potential will not be reflected in those budget projections. Consequently, as the projection horizon extends, the budget misestimates that result from miscalculating the business cycle should, on average, grow in importance, until they reach their maximum level in the last two years of the five-year period. The portion of inaccuracies attributable to the business cycle may be estimated by using the correlation between those inaccuracies and the GDP gap (the percentage difference between actual GDP and its potential value). According to the above analysis, for projections several years ahead, the level of the GDP gap is a good indicator of unexpected cyclical conditions. For projections only one or two years ahead, by contrast, the change in the GDP gap may be a better indicator of cyclical surprises than the level, because the approaching levels of the gap can be quite similar to the recent level. Using the GDP gap and its change to measure unforeseen changes in cyclical conditions, CBO estimated by means of a linear regression what portion of its past inaccuracies was attributable to business cycles (see Box 1). Restrictions on the regression incorporate the view that, of the two variables, the change in the GDP gap is the main source of uncertainty over shorter horizons and the level of the gap over longer ones. For the intermediate year (the first year after the two-year forecast), both the level of the GDP gap and its change are taken to be important indicators of unexpected cyclical changes.
The portion of the overall inaccuracies explained by the two business-cycle variables in the regression is called the cyclical part. The rest, the noncyclical part, represents the inaccuracies that result from such factors as noncyclical changes in average tax rates, capital gains realizations, the share of GDP that goes to taxpayers in high tax brackets, and federal spending for Medicare and Medicaid.(15) CBO does not expect its projection inaccuracies to display a negative or positive bias--otherwise it would change its projections. Accordingly, CBO assumed that the probability distribution of its projection inaccuracies was centered around an average of zero. The data do not contradict that assumption; the average of past inaccuracies for each horizon is not statistically significantly different from zero. Calculating the Distribution of Inaccuracies from the ModelThe regression model produces coefficients that relate misestimates of the primary deficit or surplus (shown in Table 4) to the business-cycle variables. Given the historical pattern of the business cycle, those coefficients can be used to describe the distribution of inaccuracies that might be expected to occur simply because of the business cycle. One way to describe that distribution is through the root-mean-square error (RMSE), a measure of the average size of the errors that ignores the signs of individual errors and gives extra weight to large errors.(16) The model assumes that the RMSE of the cyclical part of misestimates will rise to a plateau (see Figure 2). That model does not account for all of a given projection inaccuracy, however. What is left, the noncyclical part, also has a distribution that can be summarized by its RMSE. Like the cyclical component, that part of a misestimate has an RMSE that rises as the projection horizon lengthens, but it does not plateau (see Figure 2). For simplicity, CBO assumed that the noncyclical influences captured in the residual from the regression were independent of the cyclical component at each horizon.(17) That assumption is not contradicted by the data, and using the sample correlations makes little difference to the results.(18) The estimated RMSEs for the cyclical and noncyclical parts can be combined to form an estimate of the RMSE for the total budget misestimates. Two RMSEs are combined by squaring each of them, adding those squares together, and taking the square root of the sum. While the cyclical and noncyclical parts of each inaccuracy add up to the total inaccuracy, the RMSEs of the two parts add up to more than the RMSE for the total inaccuracy because the two parts sometimes offset each other (see Figure 2). For example, when the cyclical part is positive, the noncyclical part could be negative, resulting in a total inaccuracy that is smaller in size than the sum of the absolute size of the two parts. The estimated RMSEs for a given year were formulated as a percentage of that year's actual revenues. For the projection of the total primary deficit or surplus, those RMSEs can be converted into dollars or expressed as a percentage of GDP using CBO's current baseline projections of total revenues and GDP. The model's estimate of the distribution of budget misestimates appears generally consistent with CBO's past record. Out of 123 past projection inaccuracies for the primary deficit or surplus in 1981 through 2004, only 7 percent fall outside the calculated 90 percent confidence range--a range that ought, in a large enough sample, to encompass 90 percent of the observations (see Figure 3).
CBO's Past Inaccuracies in Projecting the Primary Deficit or Surplus, Compared with the Constructed 90 Percent Confidence Range (Percentage of GDP)
 Source: Congressional Budget Office. Note: Each thin line represents the actual inaccuracies of the set of projections made in a given year. The thick lines represent the 90 percent confidence range constructed from CBO's statistical model for inaccuracies. That range encompasses most of CBO's past record. Figure 4 compares the 90 percent confidence band for primary surplus projections with the inaccuracy of individual baselines from 1981 through 1999 (the only baselines for which the full record is available). The figure shows that the five-year projections made between 1993 and 1999 tended to be too pessimistic, and those made earlier (especially before 1992) tended to be too optimistic. The primary source of inaccuracy for the baselines between 1993 and 1999 was the unforeseen acceleration in productivity of the 1990s and the associated rapid rise in revenues. For the earlier baseline projections, the primary sources of inaccuracy were the unexpected continuation of the productivity slowdown that started in the 1970s and the recessions of 1980, 1981 and 1982, and 1990 and 1991.
Misestimates in CBO's Projections Made from 1981 to 1999 (Percentage of GDP)
 Source: Congressional Budget Office. Notes: CY = current year; BY = budget year. This figure shows misestimates in CBO's projections of the primary deficit or surplus--the total deficit or surplus excluding net interest--made at different times. Plotted points that lie below the center line reflect instances in which CBO underestimated the primary deficit or overestimated the primary surplus, whereas points above the center line reflect the opposite. In each panel, the shaded cone indicates the estimated 90 percent confidence band; that is, there was a 90 percent chance that CBO's projection would be within the shaded area. CBO estimated that confidence band on the basis of its track record since 1981 (excluding 1982, because of insufficient data). The figure excludes the effects of legislation enacted after the projections were made. CBO computes the uncertainty range for only the first five years, although the projections have covered a period of 10 years beginning with the 1996 baseline. The fan does not extend to the second five years because the record of misestimates beyond the first five years is too small to make reliable inferences about the uncertainty range for those years, and such estimates could be misleading. For example, the 1996 forecast, which is the first CBO forecast that covered a 10-year period (and which contains three of the six data points beyond the fifth year of the projection), generally had larger misestimates in the first five years than in the sixth through eighth years of that projection (see Figure 5). Generally, though, misestimates for years beyond the five-year forecast would be larger (not smaller) than those for the first five years. In the particular case of the 1996 forecast, the misestimates in the first five years, which resulted from the unexpected strength of the economy and rise in taxable income shares, were reduced significantly in the sixth through eighth years by the unforeseen effects of the 2001 recession and a fall in taxable income shares.
Misestimates in CBO's May 1996 Projection of the Primary Deficit or Surplus (Percentage of GDP)
 Source: Congressional Budget Office. Notes: CY = current year; BY = budget year. This figure shows misestimates in CBO's May 1996 projection of the primary deficit or surplus--the total deficit or surplus excluding net interest. The plotted points lie above the center line, reflecting that CBO overestimated the primary deficit or underestimated the primary surplus. The outside cone indicates the estimated 90 percent confidence band; that is, there was a 90 percent chance that CBO's projection would be within the area of the cone. CBO estimated that confidence band on the basis of its track record since 1981 (excluding 1982, because of insufficient data). The figure excludes the effects of legislation enacted after the projections were made. Uncertainty in Projections of the Total Deficit or SurplusDetermining the uncertainty range for CBO's current baseline projection of the total deficit or surplus (shown in Figure 1) requires information about how the predicted inaccuracies in the primary budget (the budget excluding net interest) will affect the government's debt-service costs. Those inaccuracies are run through a simple debt-service model that tracks how inaccuracies in projecting deficits or surpluses translate into inaccuracies in projecting debt; the model applies an interest rate that is a weighted average of CBO's current baseline projections of rates on three-month Treasury bills and 10-year Treasury notes. That model is an approximation of the model CBO uses for its budget projections. The inaccuracy in interest rate projections is not considered because its contribution to the overall inaccuracy is not expected to be substantial. The extent to which projection inaccuracies for the primary deficit or surplus are correlated across horizons is important for the computation of debt-service costs. When those inaccuracies are highly correlated, they have a larger accumulated effect on outstanding debt, and the associated change in the government's interest burden is larger. In calculating the probability distribution of projection inaccuracies for the total deficit or surplus (including net interest), CBO assumed that the cyclical and noncyclical parts would continue to have the same correlation structure as in the past.(19) The percentiles for the total deficit or surplus that are used to draw the fan chart are computed by multiplying the values associated with the various percentiles for the standard normal distribution by the calculated RMSE of the probability distribution of the total deficit or surplus at different horizons. Those percentiles are shown in Table 5 in billions of dollars, and in Table 6 as percentages of GDP. CBO will continue its efforts to refine these calculations, and welcomes suggestions for improving the methodology.
Estimated Probability Distribution of Total Budget Deficits or Surpluses in Billions of Dollars
Estimated Probability Distribution of Total Budget Deficits or Surpluses as a Percentage of Gross Domestic Product
|
|||||||||||||||||||||||||||||||||||||||||||||||||||||||||||||||||||||||||||||||||||||||||||||||||||||||||||||||||||||||||||||||||||||||||||||||||||||||||||||||||||||||||||||||||||||||||||||||||||||||||||||||||||||||||||||||||||||||||||||||||||||||||||||||||||||||||||||||||||||||||||||||||||||||||||||||||||||||||||||||||||||||||||||||||||||||||||||||||||||||||||||||||||||||||||||||||||||||||||||||||||||||||||||||||||||||||||||||||||||||||||||||||||||||||||||||||||||||||||||||||||||||||||||||||||||||||||||||||||||||||||||||||||||||||||||||||||||||||||||||||||||||||||||||||||||||||||||||||||||||||||||||||||||||||||||||||||||||||||||||||||||||||||||||||||||||||||||||||||||||||||||||||||||||||||||||||||||||||||||||||||||||||||||||||||||||||||||||||||||||||||||||||||||||||||||||||||||||||||||||||||||||||||||||||||||||||||||||||||||||||||||||||||||||||||||||||||||||||||||||||||||||||||||||||||||||||||||||||||||||||||||||||||||||||||||||||||||||||||||||||||||||||||||||||||||||||||||||||||||||


 1 wh dt+h +