Congressional Budget OfficeSkip Navigation
Home Red Bullet Publications Red Bullet Cost Estimates Red Bullet About CBO Red Bullet Press Red Bullet Careers Red Bullet Contact Us Red Bullet Director's Blog Red Bullet   RSS
PDF

Updated Long-Term Projections for Social Security

March 2005


Supplemental Data
 

The Congressional Budget Office (CBO) most recently released long-term (100-year) Social Security projections in The Outlook for Social Security (June 2004). As a result of both economic and technical revisions, those projections have changed slightly. The attached tables and figures present the updated projections. The Outlook for Social Security presented ranges of uncertainty around the market-value outcomes (previously labeled expected); the attached tables and figures include a complete update of those projections. (In late January, a partial update was posted that included only an update to the market-value projections. All of that material appears in this new update.)

CBO presents future Social Security benefits under two scenarios. In one scenario, outlays include only those benefits that the Social Security Administration has legal authority to pay under current law. That scenario assumes that all benefits are reduced annually once the trust funds are exhausted so that total outlays equal available revenues. (In the June report, this current-law scenario was described as the "trust-fund-financed" scenario.) In the second analysis, outlays include the full benefits as currently calculated. That is the "scheduled benefits" scenario.

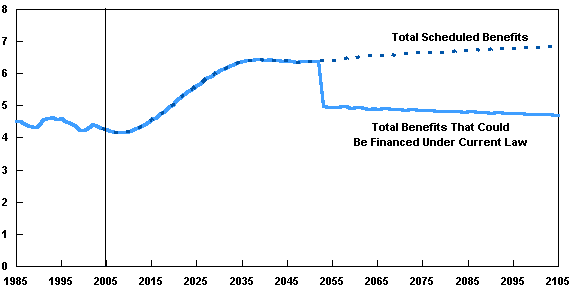
CBO projects that under current law Social Security outlays will first exceed revenues from payroll taxes and taxation of benefits in 2020 and that the program will exhaust the trust funds in 2052. After the trust funds are exhausted, Social Security spending cannot exceed annual revenues. As a consequence, because dedicated revenues are projected to equal 78 percent of scheduled outlays in 2053, CBO projects that the benefits paid will be 22 percent lower than the scheduled benefits. After 2053, the imbalance will widen, CBO projects.

Since the last estimates were released, CBO has updated its economic and budget forecast for the next 10 years (see The Budget and Economic Outlook: Fiscal Years 2006 to 2015), incorporated updated Social Security earnings records, and refined the method used to estimate retroactive disability payments. In addition, the modeling of uncertainty has been updated to reflect additional historical data, and uncertainty about another key variable--the share of compensation that will be paid as nontaxable benefits (such as health insurance)--was incorporated. While the major long-term economic assumptions did not change, there were small revisions in the estimated historical values and projected values of hours worked in the economy, as well as the projected differential growth in two measures of prices: the price index for gross domestic product (GDP) and the consumer price index.

CBO projects that, over the next 10 years, Social Security outlays will average about 0.2 percentage points lower relative to GDP than was projected last summer, primarily because of an increase in projected GDP. The difference diminishes over the following decade, and CBO projects that, for 2030 to 2050, outlays will average 0.1 percentage points higher as a percentage of GDP than projected last summer. Projected outlays for later years are essentially unchanged.

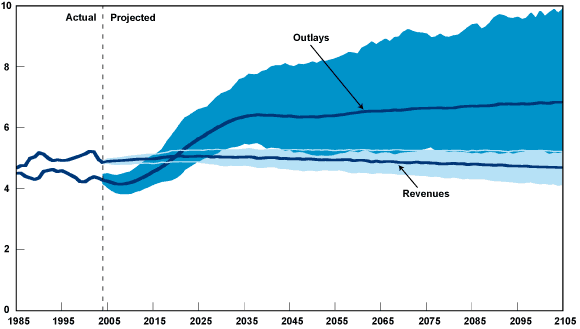
CBO revised its projection of Social Security revenues relative to GDP down slightly. CBO projects that by the end of the 100-year projection period, revenues will be 4.7 percent of GDP, 0.1 percentage point lower than projected last summer.

The range of uncertainty about the projections of Social Security revenues has increased since the June 2004 report, reflecting the inclusion of uncertainty about the share of compensation that will be paid as nontaxable benefits in the future. By 2105, the range in projected revenues as a share of GDP has increased three-fold relative to the results presented in June. That increase in uncertainty about revenues does not, however, change the conclusions stated in The Outlook for Social Security about the future of Social Security.

Figures 2-4 and 2-5 in The Outlook for Social Security included an inconsistency between the numbers and the footnotes, which said the numbers were discounted to age 60 dollars. They were instead discounted to age 16 dollars. In this update, the numbers have been adjusted to remove the inconsistency.

Table 1-1.


Social Security Outlays and Revenues as a Share of GDP in Selected Years Under the Scheduled Benefits Scenario, 2003 to 2100
  Actual
2003
2025 2050 2075 2100

Market-Value Outcome
 
Revenues 4.97 5.07 4.98 4.86 4.72
Outlays 4.35 5.64 6.37 6.65 6.82
Balance 0.62 -0.57 -1.39 -1.78 -2.11
 
80 Percent Range of Uncertaintya
           
Revenues 4.97 4.88 to 5.27 4.61 to 5.27 4.44 to 5.27 4.17 to 5.26
Outlays 4.35 4.93 to 6.60 5.13 to 8.16 5.35 to 9.08 5.26 to 9.82
Balance 0.62 -1.52 to 0.00 -3.25 to -0.34 -4.25 to -0.71 -5.02 to -0.75

Source: Congressional Budget Office.

Notes: Based on simulations using the Social Security trustees' 2004 intermediate demographic assumptions and CBO's January 2005 economic assumptions.

Revenues equal payroll taxes and income taxes on benefits as a share of gross domestic product (GDP) in the specified year.

Outlays equal scheduled Social Security benefits and administrative costs as a share of GDP in the specified year.

The balance is the difference between revenues and outlays as a share of GDP in the specified year and may not equal the difference of the previous two rows because of rounding.

a. The range within which there is an 80 percent probability that the actual value will fall (that is, the range between the 10th and 90th percentiles for each measure based on a distribution of 500 simulations from CBO's long-term model). The balances shown do not equal the difference between the outlays and revenues shown because each value is obtained from a different simulation.

Figure 1-1.


Potential Range of Social Security Outlays and Revenues Under the Scheduled Benefits Scenario
(Percentage of GDP)
Graph

Source: Congressional Budget Office.

Notes: Based on 500 simulations centered on the Social Security trustees’ 2004 intermediate demographic assumptions and CBO’s January 2005 economic assumptions.

Revenues include payroll taxes and income taxes on benefits but exclude interest credited to the Social Security trust funds; outlays include scheduled Social Security benefits and administrative costs.

Under current law, outlays begin to exceed revenues starting in 2020; starting in 2053, scheduled benefits cannot be paid.


Table 1-2.


Summarized Social Security Outlays, Revenues, and Balances Under the Scheduled Benefits Scenario
    Revenues Outlays Balance

As a Percentage of GDP
Market-Value Outcome  
  50 years (2004-2053) 5.35 5.45 -0.10
  100 years (2004-2103) 5.20 5.77 -0.57
 
80 Percent Range of Uncertaintya  
  50 years (2004-2053) 5.17 to 5.51 5.01 to 6.03 -0.67 to 0.26
  100 years (2004-2103) 4.99 to 5.40 5.31 to 6.40 -1.18 to -0.22
 
As a Percentage of Taxable Payroll
Market-Value Outcome  
  50 years (2004-2053) 13.97 14.23 -0.26
  100 years (2004-2103) 13.82 15.32 -1.50
         
80 Percent Range of Uncertainty  
  50 years (2004-2053) 13.78 to 14.15 13.14 to 15.64 -1.73 to 0.69
  100 years (2004-2103) 13.64 to 14.02 14.16 to 16.93 -3.13 to -0.58

Source: Congressional Budget Office.

Note: Based on simulations using the Social Security trustees' 2004 intermediate demographic assumptions and CBO's January 2005 economic assumptions.

Summarized outlays and revenues are the present values of annual outlays and revenues over the relevant time period divided by the present value of GDP or taxable payroll over that period.

The balance is the present value of revenues minus the present value of outlays, divided by the present value of GDP or taxable payroll over that period.

a. The range within which there is an 80 percent probability that the actual value will fall (that is, the range between the 10th and 90th percentiles for each measure based on a distribution of 500 simulations from CBO's long-term model). The balances shown do not equal the difference between the outlays and revenues shown because each value is obtained from a different simulation.

Figure 1-2.


Potential Range of the OASDI Trust Fund Ratio Under the Scheduled Benefits Scenario, 1985 to 2105

Graph

Source: Congressional Budget Office.

Notes: OASDI = Old-Age, Survivors, and Disability Insurance.

Based on 500 simulations centered on the Social Security trustees’ 2004 intermediate demographic assumptions and CBO’s January 2005 economic assumptions. The trust fund ratio is the ratio of the total trust fund balance at the beginning of a calendar year to total Social Security outlays in that year.


Figure 1-3.


Outlays for Benefits Under Current Law and Under the Scheduled Benefit Scenario, 1985 to 2105
(Percentage of GDP)
Graph

Source: Congressional Budget Office.

Notes: Based on a simulation using the Social Security trustees' 2004 intermediate demographic assumptions and CBO's January 2005 economic assumptions.

Current law benefits (those financed by legal spending authority) are projected to fall below scheduled benefits in 2053, when the trust funds have been exhausted. Thereafter benefits equal annual Social Security revenues.


Figure 2-1.


Median First-Year Retirement Benefits, by Birth Cohort
(2004 Dollars)

Graph

Source: Congressional Budget Office.

Notes: Based on a simulation using the Social Security trustees' 2004 intermediate demographic assumptions and CBO's January 2005 economic assumptions.

First-year benefits are projected assuming that all workers claim benefits at age 65. Values are net of income taxes paid on benefits and credited to the Social Security trust funds.

Current law benefits fall below scheduled benefits beginning in 2053, when the trust funds are exhausted. Thereafter benefits are projected by assuming an across-the-board cut in benefits each year such that total annual benefits are limited to total annual revenues.


Figure 2-2.


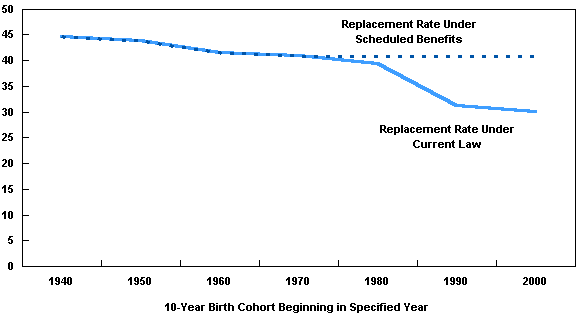
Median Replacement Rates, by Birth Cohort
(Percent)
Graph

Source: Congressional Budget Office.

Notes: Based on a simulation using the Social Security trustees' 2004 intermediate demographic assumptions and CBO's January 2005 economic assumptions.

Replacement rates are first-year benefits (net of income taxes paid on benefits and credited to the Social Security trust funds) as a percentage of average career earnings.

Current law benefits fall below scheduled benefits beginning in 2053, when the trust funds are exhausted. Thereafter benefits are projected by assuming an across-the-board cut in benefits each year such that total annual benefits are limited to total annual revenues.


Figure 2-3.


Median Lifetime Retirement Benefits, by Birth Cohort
(Present value in 2004 Dollars)

Graph

Source: Congressional Budget Office.

Notes: Based on a simulation using the Social Security trustees' 2004 intermediate demographic assumptions and CBO's January 2005 economic assumptions.

Lifetime retirement benefits have been adjusted for inflation (to put them in constant dollars) and discounted to age 60. Values are net of income taxes paid on benefits and credited to the Social Security trust funds.

Current law benefits fall below scheduled benefits beginning in 2053, when the trust funds are exhausted. Thereafter benefits are projected by assuming an across-the-board cut in benefits each year such that total annual benefits are limited to total annual revenues.


Table 2-1.


Measures of the Benefits Received by the Median Retired Worker, by Birth Cohort and Lifetime Earnings Level
10-Year
Birth Cohort
Starting in Year
First-Year Benefits
(2004 Dollars)

First-Year Replacement
Rate (Percent)a

Present Value of Lifetime
Benefits (2004 Dollars)b

Scheduled Current Law Scheduled Current Law Scheduled Current Law

  Median for All Retired Workers
1940 13,700 13,700 44.6 44.6 127,000 127,000
1950 14,400 14,400 43.9 43.9 138,300 138,300
1960 15,000 15,000 41.6 41.6 149,000 147,400
1970 17,200 17,200 41.0 41.0 172,200 162,700
1980 19,500 18,800 40.7 39.5 200,100 166,000
1990 22,100 16,900 40.7 31.2 232,600 172,200
2000 25,000 18,500 40.8 30.2 264,700 189,200
 
  Median in Lowest Household Earnings Quintile
1940 7,500 7,500 72.4 72.4 60,900 60,900
1950 8,300 8,300 69.6 69.6 69,600 69,600
1960 9,000 9,000 62.8 62.8 76,900 76,600
1970 9,800 9,800 64.5 64.5 85,500 83,000
1980 10,600 10,200 68.5 64.7 90,000 76,900
1990 12,100 9,300 67.5 51.5 109,100 80,000
2000 13,500 10,000 69.3 50.9 122,000 87,000
 
  Median in Middle Household Earnings Quintile
1940 15,500 15,500 43.1 43.1 144,300 144,300
1950 15,800 15,800 42.7 42.7 157,300 157,200
1960 16,200 16,200 40.9 40.9 168,300 166,600
1970 18,500 18,500 40.3 40.3 196,700 186,300
1980 21,300 20,500 39.8 38.8 231,400 192,100
1990 24,000 18,400 39.8 30.4 267,700 199,900
2000 27,100 20,100 39.7 29.5 306,300 217,900
             
  Median in Highest Household Earnings Quintile
1940 20,200 20,200 28.6 28.6 216,800 216,800
1950 22,300 22,300 28.0 28.0 243,000 242,800
1960 23,300 23,300 25.6 25.6 257,100 254,800
1970 26,200 26,200 25.2 25.1 296,000 277,600
1980 30,300 29,200 23.5 22.6 355,300 289,500
1990 34,300 26,300 23.5 18.0 408,000 305,300
2000 38,800 28,900 23.1 17.1 467,600 337,700

Source: Congressional Budget Office.

Notes: Based on a simulation using the Social Security trustees' 2004 intermediate demographic assumptions and CBO's January 2005 economic assumptions.

First-year annual benefits and replacement rates are computed for all individuals eligible to claim Old-Age Insurance benefits at age 62 and have not yet claimed any other benefit. All workers are assumed to have claimed benefits at age 65. All values are net of income taxes paid on benefits and credited to the Social Security trust funds. The current law scenario subjects all beneficiaries to an across-the-board cut in benefits each year such that total projected benefits equal projected revenues once the Social Security trust funds have been exhausted.

The overall median values differ from the median values in the middle quintile because individuals are sorted into quintiles on the basis of household earnings, not benefit levels.

a. First-year benefits as a percentage of average career earnings.

b. The present value of all retired-worker benefits received.

Figure 2-4.


Potential Range of Lifetime Payroll Taxes Under Current Law, by Birth Cohort and Lifetime Earnings Level
(2004 Dollars)

Graph

Source: Congressional Budget Office.

Notes: Based on 500 stochastic simulations centered on the Social Security trustees' 2004 intermediate demographic assumptions and CBO's January 2005 economic assumptions, including only individuals who live to at least age 45. The 80 percent range of uncertainty reflects the range in which the actual outcomes have an 80 percent chance of falling. Taxes include OASDI employer and employee payroll taxes. Values are adjusted for inflation and discounted to age 60.


Figure 2-5.


Potential Range of Lifetime Social Security Benefits to Under Current Law and Under the Scheduled Benefits Scenario, by Birth Cohort and Lifetime Earnings Level
(2004 Dollars)

Graph

Source: Congressional Budget Office.

Notes: Based on 500 stochastic simulations centered on the Social Security trustees' 2004 intermediate demographic assumptions and CBO's January 2005 economic assumptions, including only individuals who live to at least age 45. The 80 percent range of uncertainty reflects the range in which the actual outcomes have an 80 percent chance of falling. Benefits include Social Security benefits (including retired-worker, disabled-worker, spousal, and survivor benefits) net of income taxes paid on benefits and credited to the Social Security trust funds. Values are adjusted for inflation and discounted to age 60.


Figure 2-6.


Potential Range of the Ratio of Lifetime Social Security Benefits to Lifetime Taxes Under Current Law and Under the Scheduled Benefits Scenario, by Birth Cohort and Lifetime Earnings Level
(In percent)

Graph

Source: Congressional Budget Office.

Notes: Based on 500 stochastic simulations centered on the Social Security trustees' 2004 intermediate demographic assumptions and CBO's January 2005 economic assumptions, including only individuals who live to at least age 45. The 80 percent range of uncertainty reflects the range in which the actual outcomes have an 80 percent chance of falling. Benefits include Social Security benefits net of income taxes (as shown in Figure 2-4); taxes include employer and employee payroll taxes (as shown in Figure 2-5).


Table B-1.


Measures of the Benefits Received by the Median Retired Worker, by Birth Cohort and Lifetime Earnings Level
10-Year
Birth Cohort
Starting in Year
First-Year Benefits
(2004 Dollars)

First-Year Replacement
Rate (Percent)a

Present Value of Lifetime
Benefits (2004 Dollars)b

Scheduled Current Law Scheduled Current Law Scheduled Current Law

  Males
 
  Median for All Retired Workers
1940 17,600 17,600 38.4 38.4 153,900 153,900
1950 17,800 17,800 39.3 39.3 157,000 157,000
1960 18,000 18,000 37.8 37.8 165,200 164,100
1970 20,800 20,800 37.2 37.2 192,200 182,900
1980 23,900 22,900 36.6 35.3 225,100 186,600
1990 26,600 20,400 36.9 28.3 256,600 189,500
2000 30,200 22,400 37.0 27.5 294,900 210,000
 
  Median in Lowest Household Earnings Quintile
1940 9,100 9,100 58.5 58.5 76,500 76,500
1950 9,400 9,400 60.4 60.4 79,100 79,100
1960 9,900 9,900 57.1 57.1 82,600 82,200
1970 10,700 10,700 59.3 59.3 90,400 88,000
1980 11,500 11,100 62.2 60.1 100,000 84,800
1990 12,900 9,900 62.4 47.7 118,300 87,700
2000 14,400 10,800 64.1 47.3 130,600 92,500
 
  Median in Middle Household Earnings Quintile
1940 18,100 18,100 37.4 37.4 170,700 170,700
1950 18,400 18,400 38.9 38.9 176,900 176,900
1960 18,600 18,600 37.7 37.7 190,700 190,300
1970 21,400 21,400 36.9 36.9 223,100 212,100
1980 24,700 23,700 36.2 35.1 262,200 218,400
1990 27,500 21,000 36.7 28.1 300,200 221,500
2000 31,000 23,100 36.6 27.4 343,800 243,700
 
  Median in Highest Household Earnings Quintile
1940 21,300 21,300 21.8 21.8 243,100 243,100
1950 23,600 23,600 22.3 22.3 264,200 264,100
1960 24,700 24,700 20.4 20.4 278,600 278,300
1970 27,800 27,800 20.1 20.1 323,100 303,200
1980 32,100 31,000 18.6 17.9 384,400 310,600
1990 36,300 27,800 18.4 14.1 439,300 325,700
2000 41,000 30,600 18.2 13.6 507,500 362,800
 
  Females
 
  Median for All Retired Workers
1940 10,400 10,400 52.4 52.4 106,200 106,200
1950 11,900 11,900 49.3 49.3 124,600 124,500
1960 12,700 12,700 45.8 45.8 136,600 134,900
1970 14,600 14,600 45.1 45.1 158,500 148,800
1980 16,400 15,800 44.8 43.6 182,300 151,100
1990 18,900 14,400 44.4 34.0 214,400 159,300
2000 21,200 15,700 44.6 32.9 243,000 173,600
 
  Median in Lowest Household Earnings Quintile
1940 6,800 6,800 79.0 79.0 52,800 52,800
1950 7,700 7,700 75.8 75.8 63,600 63,600
1960 8,500 8,500 67.3 67.3 72,200 72,000
1970 9,300 9,300 68.5 68.5 81,800 78,900
1980 9,900 9,500 72.2 67.6 82,800 70,800
1990 11,500 8,700 71.6 54.5 101,000 73,600
2000 12,800 9,500 72.1 52.6 115,500 82,500
 
  Median in Middle Household Earnings Quintile
1940 11,600 11,600 50.2 50.2 116,100 116,100
1950 13,000 13,000 47.7 47.7 138,400 138,300
1960 13,900 13,900 44.5 44.5 151,000 149,400
1970 16,000 16,000 43.9 43.9 176,700 167,600
1980 18,200 17,700 43.5 42.4 206,100 171,800
1990 21,000 16,000 42.9 32.8 245,500 181,700
2000 23,900 17,600 43.1 31.7 280,100 199,900
 
  Median in Highest Household Earnings Quintile
1940 15,300 15,300 41.2 41.2 182,800 182,800
1950 18,500 18,500 37.5 37.5 213,400 213,300
1960 19,500 19,400 34.9 34.9 227,300 223,400
1970 21,900 21,900 34.5 34.5 259,300 242,100
1980 25,900 24,900 33.0 31.9 315,100 256,100
1990 29,000 22,200 32.9 25.2 359,200 270,300
2000 33,400 24,600 32.8 24.3 406,700 295,000

Source: Congressional Budget Office.

Notes: Based on a simulation using the Social Security trustees' 2004 intermediate demographic assumptions and CBO's January 2005 economic assumptions.

First-year annual benefits and replacement rates are computed for all individuals eligible to claim Old-Age Insurance benefits at age 62 and have not yet claimed any other benefit. All workers are assumed to have claimed benefits at age 65. All values are net of income taxes paid on benefits and credited to the Social Security trust funds. The current law scenario subjects all beneficiaries to an across-the-board cut in benefits each year such that total projected benefits equal projected revenues once the Social Security trust funds have been exhausted.

The overall median values differ from the median values in the middle quintile because individuals are sorted into quintiles on the basis of household earnings, not benefit levels.

a. First-year benefits as a percentage of average career earnings.

b. The present value of all retired-worker benefits received.